Power BI Vs Tableau: Which Data Visualization Tool is Better?
Choosing between Power BI vs Tableau? Compare their features, pricing, analytics, performance, and usability to find the right BI tool for your business.

Manish Kumar
AI/ML & Data Engineer

In this Article
In this Article
Let's Build the Right Solution, Not Just Software.

Summarize with AI
Short on time? Get the key points instantly with AI.
 ChatGPT
 Perplexity
Power BI Vs Tableau: Which Data Visualization Tool is Better?
Quick Answer: Power BI is usually the better choice for Microsoft-centric organizations that prioritize cost efficiency, governed reporting, and semantic data modeling. Tableau may be better for teams that prioritize advanced visual exploration and dashboard flexibility. Neither platform is universally better; the right choice depends on your data environment, users, budget, and analytics requirements.
When businesses have more data than ever to work with, data visualization tools can help. Power BI and Tableau are two leading options, but they take different approaches to turning raw data into meaningful insights. So, which is better? Based on our experience, Power BI is often the better choice for businesses that prioritize affordability, ease of use, and Microsoft integration. Tableau stands out for teams that need deeper visual analytics and flexibility.
In this Power BI vs Tableau comparison, we'll look at their key features, pricing, ease of use, performance, and analytics capabilities.
The right choice ultimately depends on what you expect from your BI tool. Whether you're a startup building its first reporting system or an established business managing complex datasets, this comparison will help you choose the platform that meets your needs.
What is Power BI?
Power BI is a business intelligence and data visualization platform developed by Microsoft. It helps businesses turn raw data from spreadsheets, databases, cloud services, and other sources into interactive reports and dashboards. Users can clean and transform data, create custom calculations, identify trends, and share insights without needing extensive coding knowledge.
One of Power BI's biggest advantages is its integration with the Microsoft ecosystem. It works smoothly with tools such as Excel, Azure, Microsoft Teams, and SharePoint, making it especially convenient for organizations already using Microsoft products. Power BI also supports web, desktop, and mobile access, allowing teams to monitor business performance from different devices.
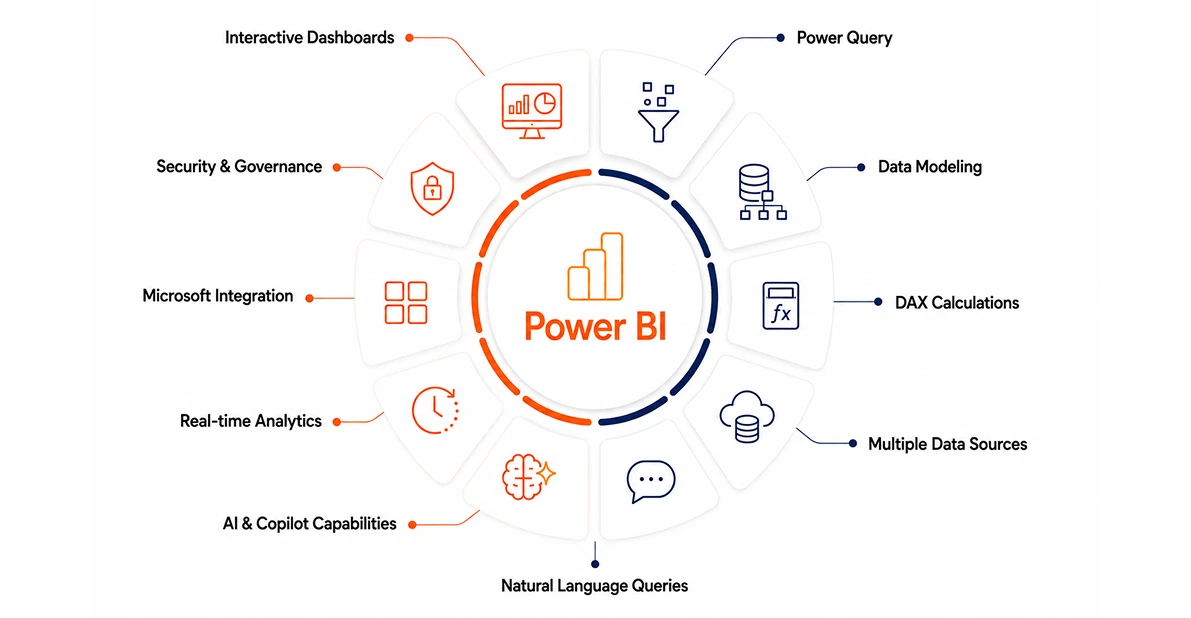
Key Features of Power BI
Interactive dashboards and reports: Create dynamic visualizations that make complex data easier to understand.
Power Query: Clean, transform, and prepare data from multiple sources before analysis.
Data modeling: Build relationships between datasets and create reusable data models for consistent reporting.
DAX calculations: Use Data Analysis Expressions (DAX) to create custom measures, calculated columns, and advanced calculations.
Multiple data sources: Connect to spreadsheets, databases, cloud platforms, APIs, and other business data sources.
Natural language queries: Ask questions about data using everyday language and receive relevant insights.
Microsoft integration: Connect Power BI with Excel, Azure, Teams, SharePoint, and other Microsoft services.
AI and Copilot capabilities: Use AI-assisted features to explore data, generate insights, and speed up report creation.
Real-time and near-real-time analytics: Connect to supported real-time and streaming data sources to monitor changing business information.
Security and governance: Manage access and protect business data with features such as role-based security and governed datasets.
What is Tableau?
Tableau, now part of Salesforce, is built around a different starting point than most BI tools: that exploring data should feel as direct as dragging shapes onto a canvas. Analysts build interactive charts, dashboards, and reports by dragging fields onto a visual workspace rather than configuring settings through menus, which is why it's usually the first tool visualization-heavy teams reach for.
Tableau can connect to a wide range of data sources, allowing users to combine and analyze information from different systems. Its drag-and-drop interface makes it possible to create sophisticated visualizations without extensive coding, while its advanced analytics capabilities support more complex data exploration and calculations.
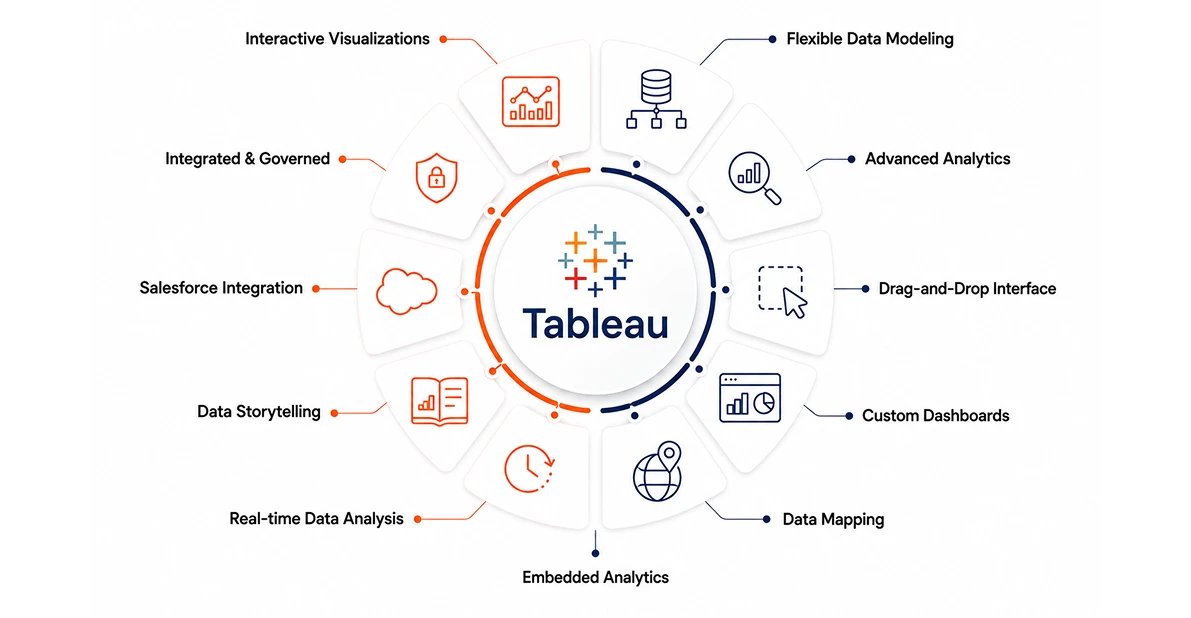
Key Features of Tableau
Interactive Visualizations: Create dynamic charts, graphs, and dashboards that allow users to explore data visually.
Flexible Data Modeling: Connect and combine data using relationships, joins, unions, and data blending depending on the analytical requirement.
Advanced analytics: Perform complex calculations, trend analysis, and statistical analysis without extensive programming.
Drag-and-drop interface: Build visualizations and dashboards through an intuitive interface with minimal coding.
Custom dashboards: Create highly interactive dashboards with filters, drill-downs, and other interactive elements.
Data mapping: Use geographic data to create maps and visualize location-based trends and patterns.
Embedded analytics: Integrate Tableau dashboards and visualizations directly into other applications and business systems.
Real-time data analysis: Connect to live data sources to monitor changing information and support faster decision-making.
Data storytelling: Combine multiple visualizations to present data as a clear and engaging story.
Salesforce integration: Connect Tableau with Salesforce and other business systems to bring analytics into existing workflows.
Power BI Vs Tableau Comparison: A Quick Overview
To make the differences easier to understand, here's a quick side-by-side comparison of Power BI and Tableau.
| Factor | Power BI | Tableau |
|---|---|---|
| Best For | Startups, SMBs, and Microsoft-centric organizations | Analysts, enterprises, and visualization-focused teams |
| Ease of Use | Easier for beginners, especially Excel users | Intuitive for visualization, but advanced features have a steeper learning curve |
| Data Visualization | Strong visuals with good customization options | Excellent visualization with greater customization and interactivity |
| Data Connectivity | 500+ connectors and strong Microsoft integrations | Wide range of data sources and connectors |
| Data Modeling | Powerful modeling with Power Query and DAX | Flexible modeling with advanced calculations and LOD expressions |
| AI | Copilot and Microsoft/Fabric ecosystem | Tableau Pulse, Tableau Agent, and Salesforce ecosystem |
| Pricing | Generally lower per-user entry price | Higher per-user licensing for many deployments |
| Analytics | Strong analytics, reporting, and AI-assisted insights | Strong exploratory and advanced visual analytics |
| Best Advantage | Affordability, usability, and Microsoft ecosystem | Visualization flexibility and advanced data exploration |
Key Differences Between Power BI and Tableau
A quick feature comparison can show what Power BI and Tableau offer, but it doesn't always reveal how those features affect day-to-day analytics.
After years of providing data visualization and BI services, our experience shows that the right choice isn't always about having more features. It's also about how easily teams can use the platform, integrate it into existing workflows, and scale it as their data needs grow. Here's a closer look at the factors that matter most.
Data Visualization
Data visualization is where the difference between Power BI and Tableau becomes noticeable. Both offer charts, graphs, maps, and interactive dashboards, but their approaches differ. Power BI focuses on fast, accessible report creation, while Tableau offers greater control over visual design and customization.
Power BI: Provides built-in visuals such as bar charts, line charts, maps, tables, and cards. Users can also add custom visuals from Microsoft's marketplace, making it easy to create polished reports quickly.
Tableau: Tableau is particularly strong when analysts need fine-grained control over visual exploration, dashboard interactions, and analytical presentation. It also provides more granular control over formatting, layouts, filters, and dashboard interactions.
Verdict: Tableau has the edge for advanced visualization and customization.
Data Modeling and Analytics
Power BI and Tableau take different approaches to data modeling and analytics. Power BI emphasizes reusable semantic models, relationships, measures, and DAX-based business logic, while Tableau gives analysts flexible relationships, calculated fields, and LOD expressions for exploratory analysis.
Power BI: Combines Power Query for data preparation with its semantic modeling capabilities and DAX for advanced calculations. Relationships, measures, and business logic can be defined centrally, helping teams maintain consistent metrics across reports.
Tableau: Supports data preparation through Tableau Prep and offers flexible relationships, calculated fields, and Level of Detail (LOD) expressions. This approach gives analysts more freedom to explore data and build complex calculations based on specific analytical needs.
Verdict: Power BI's integrated modeling and DAX capabilities make it a better choice for structured business analytics.
Data Preparation and Integration
Both Power BI and Tableau connect with a wide range of data sources, but they take different approaches to data preparation and integration. Power BI is particularly convenient in Microsoft-centric environments, while Tableau supports a broad range of databases, cloud platforms, and enterprise data sources.
Power BI: Uses Power Query for cleaning, transforming, and combining data before analysis. It also integrates seamlessly with Microsoft tools such as Excel, Azure, SharePoint, and Microsoft 365, making it convenient for organizations already using the Microsoft ecosystem.
Tableau: Supports connections to databases, cloud platforms, and on-premises sources. Tableau Prep provides additional tools for cleaning and combining data, while its data blending capabilities make it useful for working with complex and varied data environments.
Verdict: Power BI's integrated data preparation capabilities and strong Microsoft ecosystem make it the more convenient choice for many businesses.
Dashboards and Reporting
Power BI and Tableau both make it easy to transform data into interactive dashboards and business reports. Power BI emphasizes speed and simplicity, while Tableau provides more flexibility for detailed analysis and highly customized reporting.
Power BI: Offers a user-friendly drag-and-drop interface for quickly creating dashboards and reports. Its real-time data capabilities help teams monitor changing business metrics, while interactive filters, drill-downs, and visuals make reports easy to explore and share.
Tableau: Provides highly interactive dashboards with strong filtering, drill-down, and customization options. Its live query capabilities and data extracts allow analysts to explore data efficiently and build reports around specific business questions.
Verdict: Power BI's intuitive interface and faster report development give it an edge for teams that prioritize simplicity and efficiency.
Data Stack and Ecosystem
Power BI and Tableau can both fit into modern data stacks, but their broader ecosystems differ. Power BI has a strong advantage for organizations building around Microsoft Fabric and Azure, while Tableau can be a better fit for Salesforce-centric environments.
Power BI: Power BI integrates closely with Microsoft Fabric and Azure, connecting business intelligence with data engineering, warehousing, governance, AI, and analytics. This makes it particularly attractive for organizations already invested in Microsoft technologies.
Tableau: Tableau works well in diverse data environments and can be especially compelling when analyst-driven exploration and visualization are priorities. Its connection with the Salesforce ecosystem also makes it a natural choice for Salesforce-focused organizations.
Verdict: Power BI is the stronger choice for Microsoft-centric data stacks, while Tableau fits well with Salesforce-focused and visualization-driven environments.
Performance and Scalability
Power BI and Tableau can both support large-scale analytics, but neither platform is universally faster. Real-world performance depends on factors such as data-model design, query patterns, storage mode, refresh strategy, concurrency, infrastructure, and report complexity.
Power BI: Import models and the VertiPaq engine can provide fast performance for in-memory analytics, while DirectQuery and composite models support different data and workload requirements. Performance at scale depends heavily on how models, queries, and refresh processes are designed.
Tableau: Tableau uses Hyper extracts and live connections to support different analytical workloads. Performance can vary based on the underlying data source, extract design, query complexity, and dashboard configuration.
Verdict: Neither platform is universally faster. The better-performing option depends on the data architecture, workload, and how well the solution is designed and optimized.
Security and Governance
Both Power BI and Tableau provide enterprise-grade security features, including access controls, authentication, encryption, and data governance. However, Power BI has an advantage for organizations already using Microsoft's security ecosystem.
Power BI: Supports row-level security, object-level security, role-based access controls, data encryption, and Microsoft Entra ID integration. Its centralized semantic models also help organizations maintain consistent security and governance across reports.
Tableau: Provides row-level security, user and group permissions, authentication options such as SSO, and encryption for data in transit and at rest. Its governance and data catalog capabilities can support complex enterprise environments but may require additional configuration.
Verdict: Power BI can simplify governance for organizations already using Microsoft Entra ID and the broader Microsoft security ecosystem.
AI and Advanced Analytics
Both Power BI and Tableau are adding AI capabilities to make data analysis faster and more accessible. Power BI has an edge in AI-assisted reporting and productivity, while Tableau offers strong capabilities for automated insights and advanced analytics.
Power BI: Copilot can generate reports, create DAX measures, summarize data, and help users explore insights through natural language prompts. Additional features such as Key Influencers and integration with Azure Machine Learning further support AI-driven analysis. (Note: Microsoft is retiring the classic Q&A feature at the end of December 2026 in favor of Copilot; revisit this line before then.)
Tableau: Tableau uses AI-assisted capabilities, including Tableau Pulse and Tableau Agent, to surface insights and help users explore metrics through natural-language interactions. Its Salesforce Einstein integration also supports predictive and automated analytics.
Verdict: Power BI's AI-assisted report creation and broader Microsoft AI ecosystem make it useful for teams looking to accelerate everyday analytics.
Pricing and Total Cost of Ownership
Pricing is one of the biggest differences between Power BI and Tableau. While the exact cost depends on your users, deployment, and requirements, Power BI generally has a lower entry cost and total cost of ownership than Tableau.
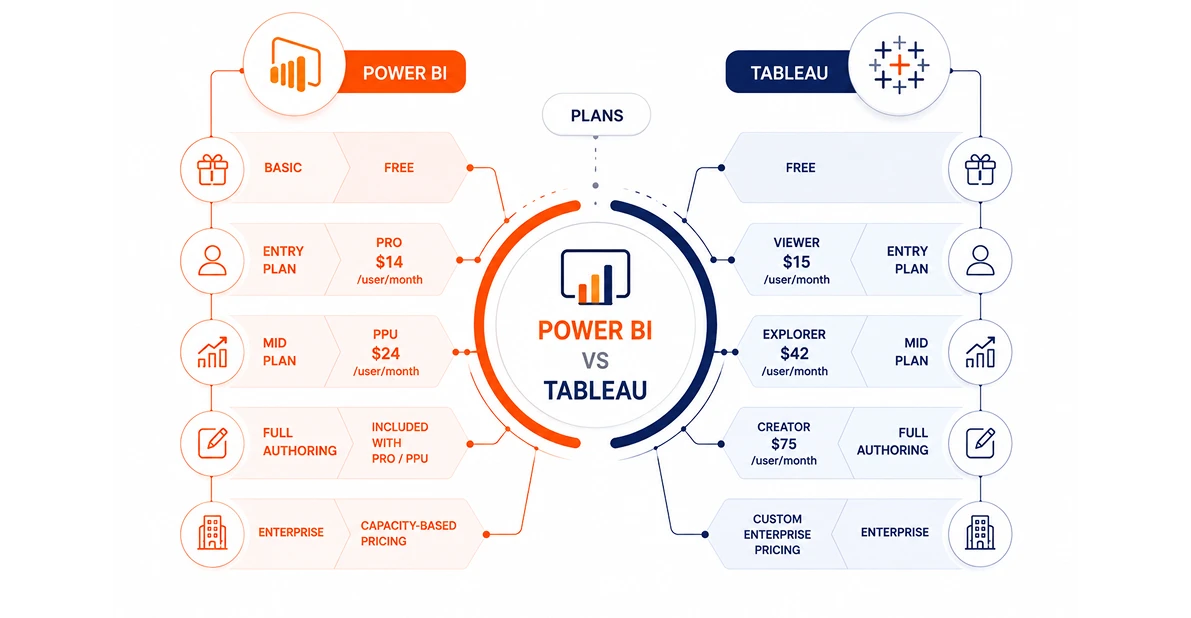
Power BI: Power BI offers a free desktop experience for individual use, while Pro provides sharing and collaboration features. Premium Per User adds advanced capabilities for organizations with more demanding analytics requirements. For larger deployments, capacity-based licensing can support broader access without requiring every viewer to have an individual Pro license.
Tableau: Tableau's licensing is divided into Creator, Explorer, and Viewer roles. Creator provides full authoring capabilities, while Explorer and Viewer are designed for users who primarily explore or consume existing content. This tiered structure offers flexibility but can become more expensive as teams scale.
Total cost of ownership: License fees are only part of the equation. Training, implementation, data infrastructure, administration, ongoing maintenance, and contract terms can all affect the final cost. For example, Tableau licenses are billed annually across all tiers, while Power BI offers more flexible billing options. Businesses should evaluate these factors alongside the subscription price.
Verdict: Power BI is often the more cost-effective choice for organizations already invested in Microsoft products, while Tableau can justify its higher licensing cost when advanced visual analytics and analyst flexibility are central requirements.
| Business Requirement | Better Fit | Why |
|---|---|---|
| Microsoft 365 Reporting | Power BI | Strong Microsoft ecosystem integration |
| Excel-Heavy Organization | Power BI | Familiar workflow and Microsoft ecosystem |
| Executive KPI Dashboards | Power BI | Strong governed reporting and semantic modeling |
| Advanced Data Visualization | Tableau | Greater visual exploration flexibility |
| Analyst-Led Exploration | Tableau | Strong exploratory workflow |
| Self-Service Business Reporting | Power BI | Accessible for many business users |
| Salesforce-Centric Analytics | Tableau | Strong Salesforce ecosystem alignment |
| Embedded Analytics | Depends | Evaluate embedding architecture and licensing |
| Complex Enterprise Governance | Depends | Evaluate identity, security, data architecture, and operating model |
| Lowest Licensing Entry Point | Power BI | Generally lower per-user entry pricing |
Power BI Vs Tableau: Which is Better for Your Organization?
There's no winner between Power BI and Tableau. Our hands-on work with BI implementations has shown that the better choice depends on factors such as your organization's size, budget, existing technology stack, and analytics needs. Here's a simple breakdown to help you decide.
Best Fit for Small Business
Power BI is generally the better choice for small businesses. Its lower cost, easy-to-use interface, and strong Microsoft integration make it practical for teams with limited budgets and technical resources. It also provides the dashboards, reporting, and analytics capabilities most small businesses need.
Best Fit for Mid-sized Business
Power BI is usually the better fit for mid-sized businesses, especially those already using Microsoft 365, Excel, Azure, or Teams. Its data modeling, collaboration, and reporting capabilities can support growing analytics needs while keeping costs manageable. Tableau may be better when advanced visualization is a priority.
Best Fit for Enterprise Organization
Tableau can be the stronger choice for large enterprises with complex data and advanced visualization needs. It offers greater flexibility for handling large datasets and building highly customized dashboards. However, Power BI remains a strong enterprise option for organizations deeply invested in Microsoft tools and looking to control costs.
Final Takeaway
Power BI and Tableau both deliver strong business intelligence, but they excel in different areas rather than one simply beating the other. Power BI has the edge for affordability, Microsoft integration, data modeling, and AI-assisted analytics. Tableau has the edge for visualization depth, customization, exploratory analysis, and large-scale data handling.
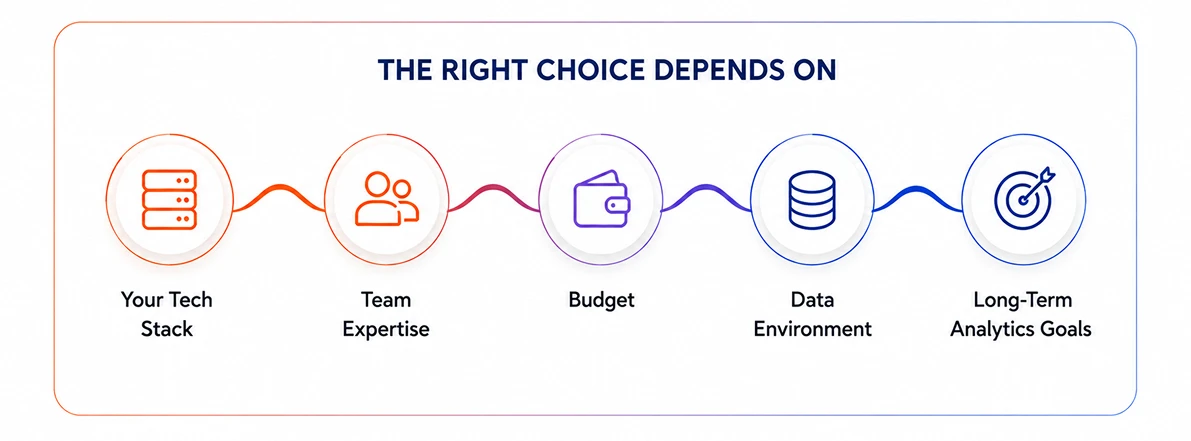
Choosing between them comes down to what matters most for your organization. Your existing tech stack, team expertise, budget, data environment, and long-term analytics goals should all factor into the decision.
At NebulaTech, we start with understanding your business and analytics needs before recommending a BI approach. Once the right direction is clear, our data visualization & BI services help bring that strategy to life through implementation and optimization. Talk to our experts to find the right BI approach for your business.
FAQs on Power BI vs Tableau
Yes, you can learn both, especially if you already understand data analysis and visualization. However, it's usually better to learn one platform first and build a strong foundation before moving to the other. This makes it easier to understand the differences in their tools, workflows, and analytics features.